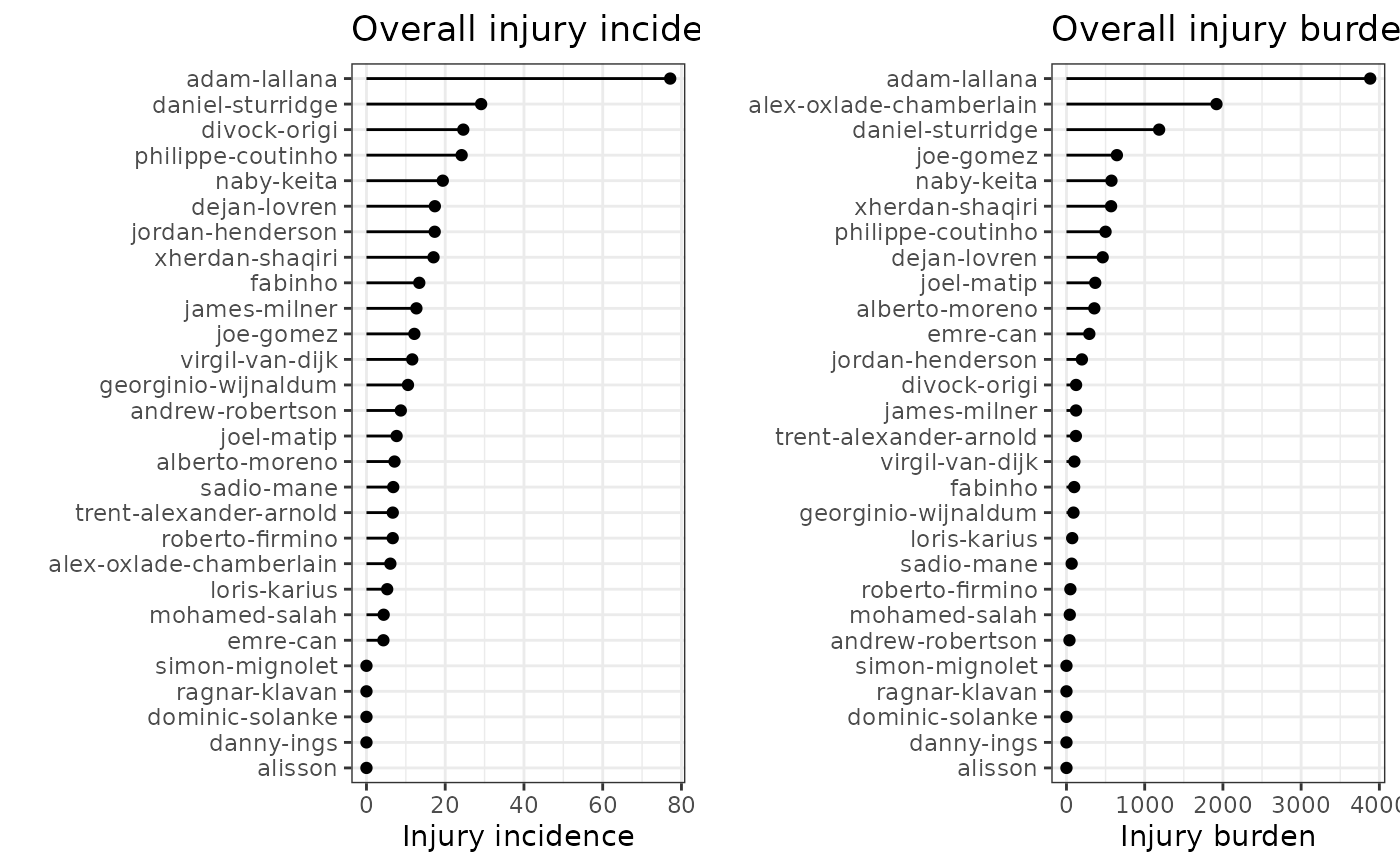
A bar chart that shows player-wise injury summary statistics, either injury incidence or injury burden, ranked in descending order.
Usage
gg_injbarplot(injds, type = c("incidence", "burden"), title = NULL)Arguments
- injds
injdsS3 object (seeinjsummary()).- type
A character value indicating whether to plot injury incidence's or injury burden's ranking. One of "incidence" or "burden", respectively.
- title
Text for the main title.
Examples
# \donttest{
df_exposures <- prepare_exp(raw_df_exposures, player = "player_name",
                            date = "year", time_expo = "minutes_played")
df_injuries  <- prepare_inj(raw_df_injuries, player = "player_name",
                            date_injured = "from", date_recovered = "until")
injd         <- prepare_all(data_exposures = df_exposures,
                            data_injuries  = df_injuries,
                            exp_unit = "matches_minutes")
# }

injds <- injsummary(injd)
#> Warning:
#>   Exposure time unit is matches_minutes
#>   So... Injury incidence and injury burden are calculated per 100 player-matches of exposure (90 minutes times 100)
#>
#> Warning:
#>   Exposure time unit is matches_minutes
#>   So... Injury incidence and injury burden are calculated per 100 player-matches of exposure (90 minutes times 100)
#>

p1 <- gg_injbarplot(injds, type = "incidence",
                    title = "Overall injury incidence per player")
p2 <- gg_injbarplot(injds, type = "burden",
                    title = "Overall injury burden per player")

# install.packages("gridExtra")
# library(gridExtra)
if (require("gridExtra")) {
  gridExtra::grid.arrange(p1, p2, nrow = 1)
}
#> Loading required package: gridExtra